Senz Chocolates
The survey was designed to include an overall look at the Chinese chocolate industry, consumer patterns, preferences for brands and a zoom in on Senz in this context. According to the calculations in the previous blog post, the minimum sample size was 82 respondents per strata. However, considering the time, language and resources constraints, the team focused only on Shanghai. In order to ensure a certain rate of diversity, several places preferred by middle class were chosen: Pudong, People’s Square, West Nanjing Road, both inside and outside several shopping malls. The number of valid surveys was 107.
The content of the survey was mostly quantitative data oriented in order to create a clear picture of the industry, and also to avoid any language barriers which can result from open ended questions. The survey also explored consumer feelings towards chocolate in general, different categories, moments of consumption etc. by using the Likert scale.
For a full interactive experience of the dashboard, please click here. The data set of the survey can be previewed here.
1. Survey
Consumption Patterns
Like/buy/receive
The first three general patterns explored – “I like chocolate”, “I buy chocolate”, “I receive chocolate as a gift” show that consumers are experiencing all three of them equally. This suggests a positive environment, where demand and supply are in balance. Considering chocolate liking from a gender point of view, women seem to have a higher preference towards the product. However, considering that the male population is only 19.62% of our sample, the proportion of their answers should be weighted more. Most of women and men say they either “agree” or “strongly agree” with the first affirmation “I like chocolate”. The same positive attitude can be subtracted by looking at the division by age, especially for people from 20 to 34 years. Of course, this category was the best represented among our sample, but it is important to consider they are either “emerging” consumers – very young, at their first jobs, whose tastes are being shaped as we speak – and adult consumers, who already have the financial opportunities to indulge themselves.
This is confirmed by the analysis on buying chocolate by monthly income: the groups with the strongest positive attitude towards the affirmation of buying chocolate have high monthly incomes of 5000 – 12500 RMB. One aspect the team decided to explore was the correlation between liking chocolate and buying reasons. It can be seen from the dashboard that both women and men purchase chocolate mainly for the taste, but the secondary reason sets them apart. For women it’s health, whereas for men it’s gift. This is a very interesting and valuable insight, as it can be used to personalize communication per gender, according to the purpose of purchase.
When, how and what type of chocolate
Trying to better understand the psychology of the consumer when it comes to chocolate consumption, the survey went into how often chocolate is consumed (from daily to monthly) and what is the usual occasion: special occasions (such as holidays, anniversaries), in moments of craving (as sweet tooth) or as a snack between meals. Combining the two and analyzing them by gender and age group, it can be seen that women’s reasoning is related to “sweet tooth” and special occasions, mostly twice a week, and this pattern is valid throughout age groups. For men, “special occasions” are dominant, and the frequency is lower.
Exploring the categories of chocolate (as defined by Euromonitor in their recent analysis of the Chinese chocolate industry) correlated with eating frequency, some unique findings emerge: milk chocolate is chosen every day and once a week evenly and more “twice a week”, while dark chocolate follows the same pattern, with a higher percentage of “twice a week”. Truffles, pralines and filled chocolate encounter peaks at “once a week” and “every day”.
Milk chocolate is overall the most preferred type of chocolate, confirming the official industry analysis. However, applying the age group split, it can be observed that dark chocolate is the favorite of the 20-24 year olds. This again is valuable from a marketer’s point of view, as Senz can focus and grow this segment, through education for building taste.
Brands, Brands, Brands
The survey asked the consumers which brands they usually eat, enabling multiple choices and then requested a single selection for their favorite one. The results confirm official data: Dove, Hershey’s, Ferrero and Snickers were among the top choices of participants in the survey. Lindt was not included in the list of our survey, but was naturally mentioned by 5.6% of respondents as their favorite brand and all of them had monthly income of over 5000 RMB, suggested a strong affinity for this brand in the upper middle class.
Senz
25.23% of respondents replied they know the brand. Although brand awareness is lower than for the other top international brand, those who have tried it appreciate the taste and 78% of them would recommend it.
Although Senz is not in direct competition with the top foreign brands, the analysis looked into what is the favorite of respondents who know Senz, that being Hershey’s, and of those who do not know Senz, it is Ferrero. Senz was chosen as favorite brand by 3 respondents.
Anticipating that Senz is not going to be top of mind for consumers – considering the low promotion discovered during the research for the first assignment – the survey tried to touch upon main reasons why people prefer Senz, to see whether taste, packaging or the healthy attribute of dark chocolate is triggering consumption more than the other. Looking at the correlation between reasons chosen, gender and monthly income (considering the premium positioning), it can be seen that the lowest income category prefers it for the healthy attribute, whereas the middle category choses it for the packaging – suggesting care for image -, and high monthly income respondents answered “taste”.
Furthermore, the correlation between reasons why consumers prefer Senz and why they generally eat chocolate was also explored. The strongest match is for “taste”, whereas, those who prefer it for health reasons, mostly buy chocolate as gift, which can be extrapolated for future communication campaigns.
The final charts try to analyze the relationship between the profiles of consumers who know Senz and those who do not, and the later ones were split in two categories depending on their prefered chocolate brands: „Normal brands” (Dove, Hershey’s, M&Ms, Snickers – low priced, mass-market) vs ”Fancy brands” (Godiva, Neuhaus, Lindt – higher price, premium & luxury brands).
The data shows that consumers who prefer normal brands eat chocolate more often than those who consume the other type of brands. In both categories, the younger public is more open to more frequent consumption, validating an earlier insight which points to this segment as having potential to grow, through educational programs and campaigns.
When it comes to Senz consumers, the most interesting correlation is between age and income. The most diversified segment is the one between ages 25 and 29, whereas in the other groups there are more consumers in the first category of monthly income, which can prove to be a relevant indicator for the process of setting the prices
4. Conclusions
The chocolate industry is very dynamic at the moment and the purpose of these research efforts were to discover strong points of Senz and what are the potential challenges it faces in order to break through the “other” category.
The main positive points are the:
-
Overall preferences for chocolate and high buying power
-
Preference for dark chocolate and frequent eating habit
-
Correct perception of core Senz brand attributes: taste, packaging, healthy
Relevant and interesting insights
-
Both women and men buy chocolate for taste, but the first prefer it also for health reasons, whereas the men purchase it as a gift
-
High preference for dark chocolate among the youngest target
-
Chocolate consumption is still frequently associated with special occasions
Obstacles:
-
Very strong awareness of top 5 brands
-
Fierce competition in distribution
-
Side effects of poor promotion & lack of advertising presence
2. Sampling
In addition to our survey, Team 1 also conducted a sampling activity with different kinds of Senz Chocolate. The reactions of people who tasted it were recorded. The following movie shows the captured qualitative data, which supports the quantitative findings
3. Interview with distributor
In order to make the research more conclusive, the marketing team also conducted interviews to some shop chains like Lawsons. The aim was to understand the process of choosing specific brands and what type of different incentives do the shops have to include a specific brand in their inventory.
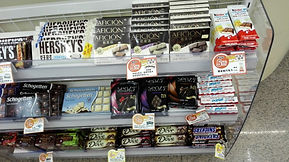
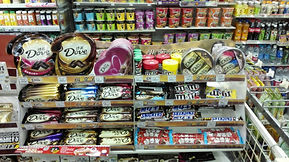
As it was expected from the customer research survey Dove is the chocolate that is most often in the shop. What the team also found out is that Hershey`s is the brand which is most aggressive in their promotions in an attempt to surpass Dove in market share. Furthermore what the team understood is that how a certain brand is exhibited in the shops depends a lot on their relationship and not only on the investment that is made. This can also be explained by the fact that the profitability of the shop is similar for most of the different chocolate brands.
Last, but not least, what determines if a shop would decide to include a certain brand in their inventory is the customer rating and popularity that it has.
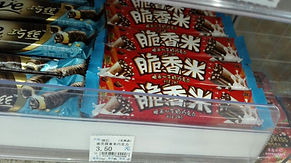
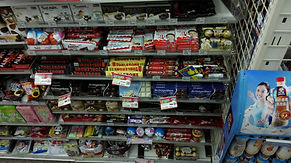
As it can be seen from the pictures below, the arrangement of the products is dynamic, it changes according to the factors above.
Week 24-30/11/2014


Week 01-05/12/2014